Designing Clarity: Dashboard That Drive Business Decisions
I design dashboards that make data feel simple and decisions feel easy.
This collection is built for leaders across marketing, support, HR, finance, and sales—helping them see what matters, spot patterns, and act with confidence.
Scroll down to see how thoughtful design turns data into direction.

Sales performance dashboard
Purpose:
Tracks sales goals, pipeline health, and rep performance. Supports sales leaders in measuring effectiveness and forecasting future performance.

Target users
An idea of how the target users are going to benefit from the data.
Marketing head
benefits by analyzing lead sources and campaign ROI to refine targeting strategies
Sales manager
uses the dashboard to track team performance, conversion rates, and pipeline health, enabling better coaching and forecasting
Regional manager
monitors location-wise revenue to allocate resources and focus efforts on high-performing areas
Senior leadership
gains a high-level view of sales trends and business value, supporting strategic decision-making and growth planning.
KPI's that matters

Quick Look: Core Sales KPIs
-
Average Order Value evaluates the effectiveness of upselling strategies.
-
Opportunities reflects the health and strength of the sales pipeline.
-
Revenue monitors overall sales performance.
-
Order Lead Difference identifies delays that may impact customer satisfaction.
-
Average Response Time tracks how quickly leads are engaged, crucial for improving conversions.
Together, these KPIs enable quicker and more informed decision-making.

Sales Funnel & Lead Insights
-
Conversion Rate Funnel helps identify where leads drop off, enabling managers to optimize each sales stage.
-
Cross-sell vs Up-sell metric reveals which approach is generating more revenue, guiding strategy refinement.
-
Inbound vs Outbound Leads tracking shows which lead generation method is more effective, aiding resource allocation.
Together, these KPIs offer clear visibility into sales strategy performance and efficiency.
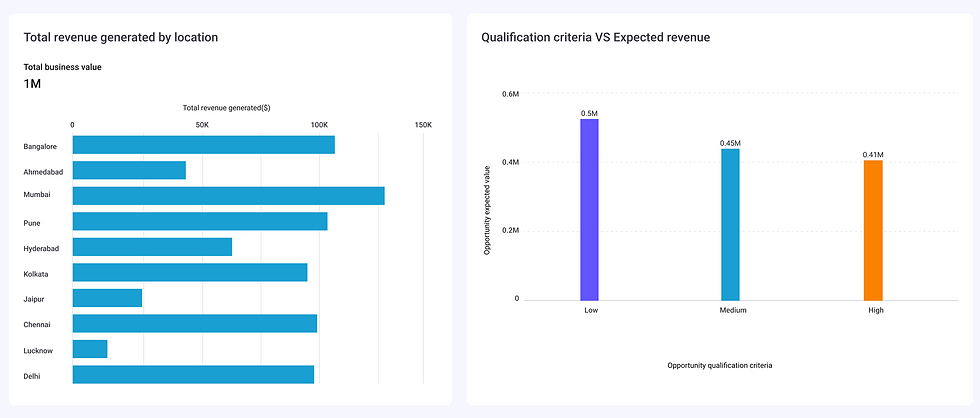
Regional Revenue & Opportunity Qualification
-
Revenue by Location shows which regions perform best, helping prioritize resources and tailor strategies.
-
Qualification vs Expected Revenue assesses lead quality, improving forecasting and deal prioritization.

Sales Flow & Pipeline Overview
-
Sales Flow visualizes the monthly trends in leads, opportunities, and orders, helping identify seasonal patterns and performance gaps.
-
Sales Pipeline shows lead conversion at each stage, allowing teams to optimize funnel efficiency and improve close rates.
Sales Dashboard UI
